

The report center in Mstnd: all your organization's reports in one place
In this article
The report center in Mstnd is the page that gathers all of the system's reports, organized by section: documents and folders, administrative correspondence, tasks, transactions, circulars and users. From it you search for any report by its name or description and open it to filter and export it, or you move to the «Analytics dashboard» to see the key charts on one screen. It serves managers, quality and compliance officers, and anyone who needs accurate numbers to make a decision.
Quick overview
| Item | Details |
|---|---|
| Module | Reports |
| Where it is in the interface | The «Reports» item in the side menu |
| Direct link | https://app.mstnd.sa/reports |
| Goal | Quick access to any report in the system, classified by the section it belongs to |
| Who it is for | Senior management, department managers, quality, audit and compliance officers, and administrative communications officers |
| Video length | About 43 seconds |
| What you will learn | Understanding how reports are grouped, telling basic and advanced reports apart, searching for a report, and opening reports and the analytics dashboard |
Watch the video
The video is a tour of the report center: its sections, the reports inside each section, the search, and moving to any report or to the analytics dashboard.
Why this feature?
Every operation in Mstnd leaves a trace: uploading a document, sending correspondence, completing a task or approving a step in a transaction. These traces are valuable data, but they are of no use unless they are gathered and presented in a way that answers management's questions. How much correspondence is waiting for a reply? What share of tasks is overdue? Who views sensitive documents? How much storage is being used?
Without a central place, employees resort to collecting numbers by hand in spreadsheets, a method that is slow, error-prone and quickly out of date. The report center solves this with ready-made reports built on the actual data in the system.
| Before | After |
|---|---|
| Collecting numbers by hand from different screens | Ready-made reports classified by section |
| A monthly report takes days to prepare | You open and filter the report you need in minutes |
| Numbers differ from one department to another | One source of data: the system itself |
| It is hard to know which reports are available | A clear list with a description of each report, and quick search |
The value for the organization is decisions built on reliable numbers. The value for the individual is the time saved on preparing reports, and the focus on reading them.
Where to find it
- From the side menu, click «Reports».
- The «Report center» page opens directly.
Direct link: https://app.mstnd.sa/reports
Two pages branch off the report center: the analytics dashboard, which shows the key charts, and the report page of each individual report.
Concepts and terms
| Term | Meaning in Mstnd |
|---|---|
| Report center | The main page that gathers all of the system's reports, organized by section |
| Section | A group of reports for a single module, such as «Documents and folders» or «Administrative correspondence» |
| Report card | An item that shows the report's name and a short description of what it measures |
| «Advanced» badge | A mark that distinguishes advanced reports from basic reports |
| Analytics dashboard | A page that shows the key charts from all reports on one screen |
| Permission scope | The data you see in a report is limited to what your permissions allow |
Step by step
Step 1: Get to know the report center
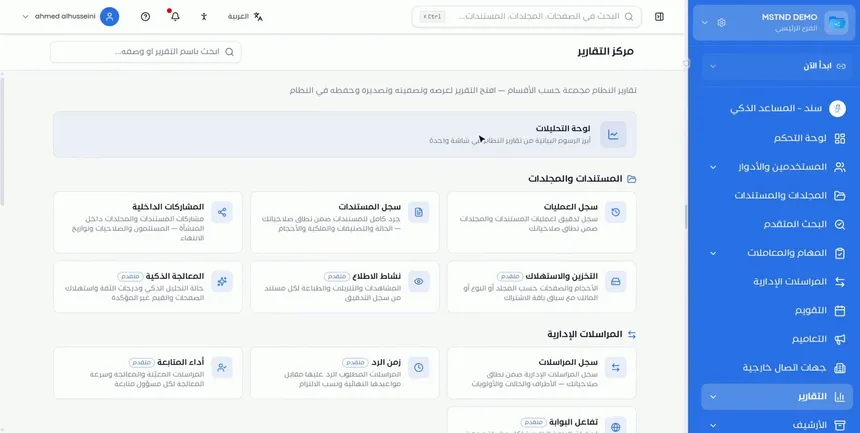
When you open «Reports», the «Report center» page appears, with a description under its title that sums up its idea: the system's reports grouped by section, where you open any report to view, filter, export and save it in the system.
At the top of the page is the «Analytics dashboard» card, with the report sections under it. In the corner is a search field for quick access.
Step 2: Explore the «Documents and folders» section
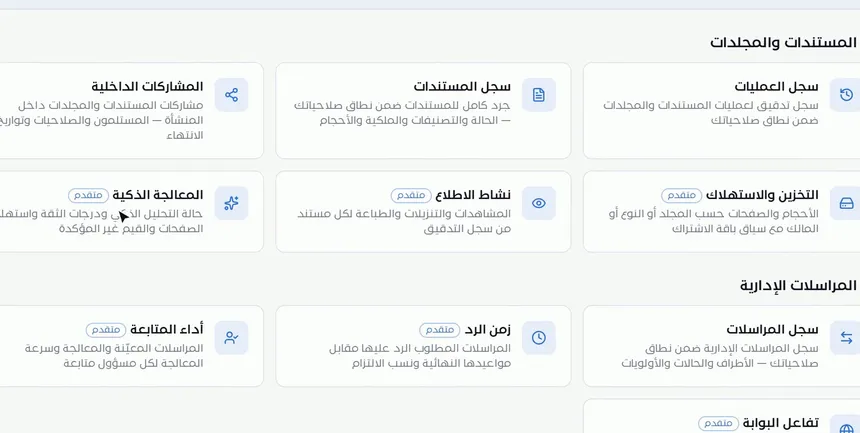
The first section is «Documents and folders», with reports that cover the life cycle of a document:
| Report | What it shows |
|---|---|
| Operations log | An audit log of document and folder operations within your permission scope |
| Document log | A full inventory of documents within your permission scope: status, categories, ownership and sizes |
| Internal shares | Shares of documents and folders inside the organization: recipients, permissions and expiry dates |
| Storage and usage | Sizes and pages by folder, type or owner |
| Viewing activity | The views, downloads and prints of each document, from the audit log |
| AI processing | The status of the AI analysis, confidence scores, page consumption and unconfirmed values |
These reports answer governance questions: What do we have? Who can reach it? And what has happened to it?
Step 3: Get to know the other sections and the advanced reports
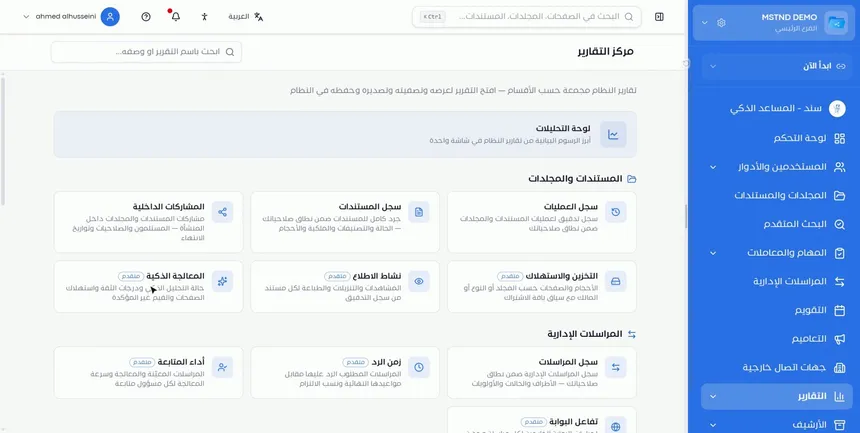
After documents come the other sections: administrative correspondence, tasks, transactions, circulars and users. In the «Administrative correspondence» section, for example, you find «Correspondence log»; «Response time», which measures the correspondence that requires a reply against its deadlines and the compliance rates; «Follow-up performance», which measures the processing speed of each follow-up officer; and «Portal engagement».
Notice that some reports carry an «Advanced» badge. This badge distinguishes the deeper analytical reports from the basic reports that show records.
Step 4: Search for a report by name or description
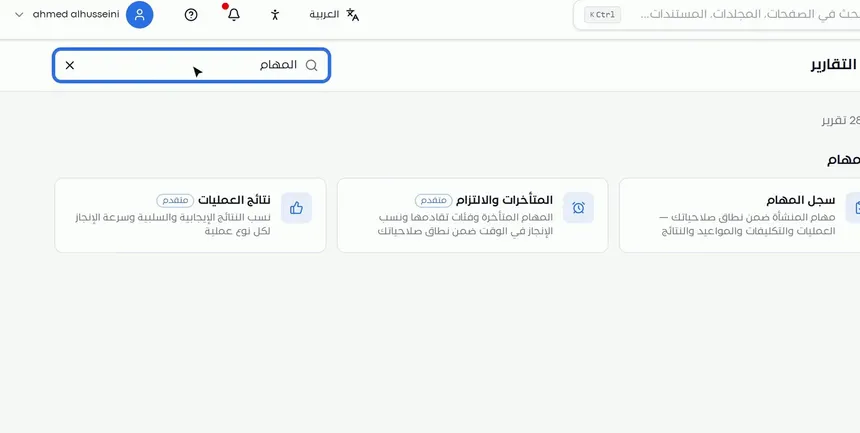
In the «Search by report name or description» field, type a word that describes what you want, such as «tasks». The center filters the cards instantly to show the matching reports, such as «Task log», «Overdue and compliance» and «Operation outcomes».
The search covers the description too, which is useful when you do not know the exact name of the report. If you search for a concept such as «delay» or «storage», you find the reports whose description deals with it.
Step 5: Open a report or the analytics dashboard
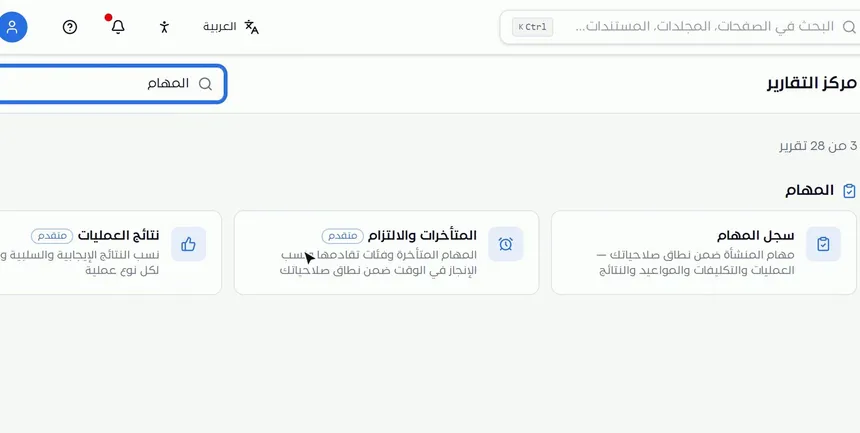
Click any report card to open its page. There you find indicators, charts, filters and a data table, with options to export, schedule and save in the system. The details are in the report page guide.
Or click «Analytics dashboard» to see the key charts from all reports on one screen. The details are in the analytics dashboard guide.
Options and their effect
| Option or setting | What it does | When to use it |
|---|---|---|
| «Analytics dashboard» | Opens the page of combined charts | For a quick overview of the organization's performance |
| Report card | Opens the report page with its indicators, filters and table | When you need the details of a specific topic |
| Search field | Filters the reports by name or description | When you know what you want to measure but not the name of the report |
| Clear search (×) | Shows all reports again | After you finish searching |
| The «Advanced» badge | Points you to the analytical reports | When you need performance and compliance measures, not just records |
Which report fits your question?
| Your question | The right report | Section |
|---|---|---|
| What happened to specific documents and folders? | Operations log | Documents and folders |
| Which documents do we have, and what is their status? | Document log | Documents and folders |
| Whom have we shared documents with, and with what permissions? | Internal shares | Documents and folders |
| Where is storage being used? | Storage and usage | Documents and folders |
| Who viewed, downloaded or printed a document? | Viewing activity | Documents and folders |
| What is the status of the AI analysis of documents? | AI processing | Documents and folders |
| Which correspondence do we have, and what are its statuses? | Correspondence log | Administrative correspondence |
| Do we reply to correspondence on time? | Response time | Administrative correspondence |
| How fast does each follow-up officer process items? | Follow-up performance | Administrative correspondence |
| Which tasks are overdue, and how old are they? | Overdue and compliance | Tasks |
| What are the rates of positive and negative outcomes? | Operation outcomes | Tasks |
This table gives you a shortcut. Start from the question you want answered, then open the matching report. If your question is not here, search with a word that describes its topic: the search goes through the descriptions of all reports in every section, including the transactions, circulars and users sections.
Practical scenarios
Scenario: The quality department in a government entity prepares a quarterly review
Situation: The department must assess compliance with the reply deadlines for correspondence during the quarter.
What you do in Mstnd:
- Open the report center and go to the «Administrative correspondence» section.
- Open the «Response time» report to see the compliance rates.
- Open «Follow-up performance» to see the processing speed of each officer.
Result: A clear picture of compliance with reply deadlines and of where the delays happen.
Scenario: An IT manager in a trading company monitors storage
Situation: The manager notices growth in the size of documents and wants to know where it comes from.
What you do in Mstnd:
- Search for «storage» in the report center.
- Open «Storage and usage» to see the sizes by folder, type and owner.
Result: The largest folders are identified, and the decision is based on data.
Scenario: A compliance officer in a hospital reviews access to files
Situation: The officer must verify that sensitive documents are viewed only by authorized people.
What you do in Mstnd:
- Open «Viewing activity» from the documents and folders section.
- Review the views, downloads and prints.
- Review «Internal shares» to check the sharing permissions and their expiry dates.
Result: Documented proof of who viewed what, which supports compliance requirements.
Scenario: A project manager in a contracting company follows up overdue tasks
Situation: Several tasks in a project are behind schedule, and the manager needs to know how big the delay is.
What you do in Mstnd:
- Search for «tasks».
- Open «Overdue and compliance» to see the overdue tasks and their aging categories.
Result: The size and distribution of the delay are known, and work starts on the oldest items first.
How it relates to other features
- Analytics dashboard: opens from the top of the report center and shows the key charts from all reports.
- Report page: the page that opens when you click any report, with the filters, export and scheduling.
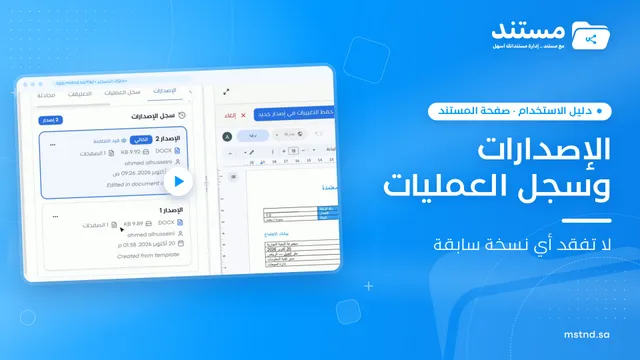
- Versions and operations log: the operations log at the level of a single document, while the «Operations log» report gathers operations at the level of the organization.
- Administrative correspondence: the data source of the correspondence, response time and follow-up performance reports.
- Tasks: the data source of the task log and of the overdue and compliance report.
- Transactions: the data source of the transaction and workflow reports.
- Permissions: define the scope of the data you see in each report.
Tips and best practices
- Search by concept, not only by name: the search covers the description of each report.
- Start with the analytics dashboard for the overview, then move to the detailed report.
- Read the card's description before opening the report, to make sure it answers your question.
- Keep record reports and advanced performance reports apart: the first are for inventory, the second for evaluation.
- Define a fixed set of reports for each periodic meeting, so you compare the same numbers over time.
- Remember that the numbers depend on your permissions, so do not compare your report with that of a colleague who has a different scope.
- Use scheduling from the report page for the reports you need regularly, instead of opening them by hand.
Warnings and common mistakes
FAQ
What is the report center in Mstnd?
It is the page that gathers all of the system's reports, organized by section. From it you open any report to view, filter and export it, or you move to the analytics dashboard.
Which sections does the report center cover?
It covers documents and folders, administrative correspondence, tasks, transactions, circulars and users.
How do I find a specific report quickly?
Type a word in the «Search by report name or description» field, and the cards are filtered to show the reports whose name or description matches.
What does the «Advanced» badge on some reports mean?
It distinguishes the advanced analytical reports, such as compliance and performance reports, from the basic reports that show records.
What is the difference between the report center and the analytics dashboard?
The report center is a list of all reports, so you can open any of them in detail, while the analytics dashboard shows the key charts from all reports on one screen.
Do all users see the same numbers in the reports?
No. Reports show data within each user's permission scope, so the numbers differ from one scope to another.
Can reports be exported?
Yes. From the report page you can export, print, schedule and save in the system, as the report page guide explains.
Summary
- The report center gathers all of the system's reports, classified by section.
- Each card shows the report's name and a description of what it measures.
- The «Advanced» badge distinguishes performance and analysis reports from record reports.
- The search covers names and descriptions for quick access.
- The «Analytics dashboard» is for the overview, and the report page is for details and export.
Try it free: Create your organization's account in Mstnd
Was this article helpful?
Related articles
 0:25
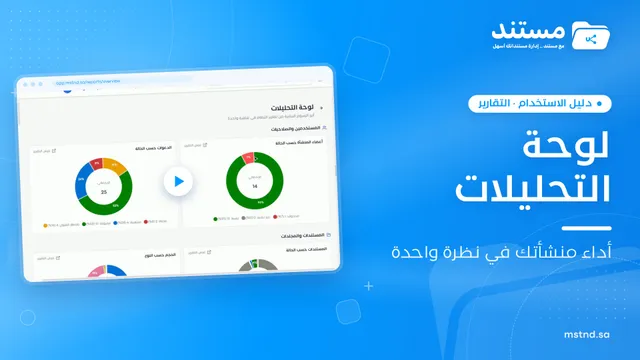
The analytics dashboard in Mstnd: your organization's performance at a glance
The analytics dashboard in Mstnd shows the key charts from every report on one screen, grouped by users, documents, tasks, transactions and correspondence.
 0:56
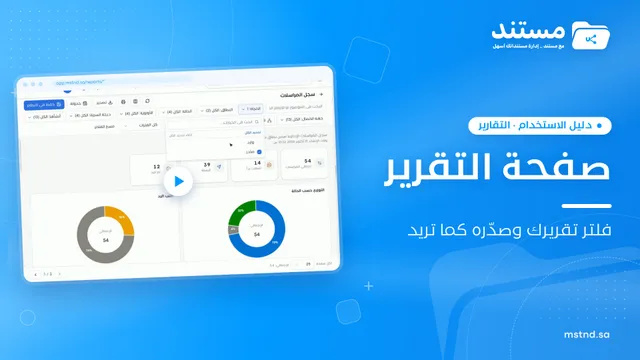
The report page in Mstnd: filter, export and schedule your report
Learn the Mstnd report page: indicators and charts, filters, the data table, export to Excel, CSV and PDF, scheduling, and saving as a document in the system.
 0:38
Versions and the operations log in Mstnd: a complete history for every document
Mstnd versions and the operations log: save edits as a new version and keep the old one, view, download or translate any copy, and track who did what and when.
 0:50
Administrative correspondence in Mstnd: outgoing and incoming in one organized register
Administrative correspondence in Mstnd: outgoing and incoming in one register, indicators, filters by direction, status and confidentiality, and reply threads.
 0:56
The Tasks page in Mstnd: your tasks and your team's in one place
Mstnd's Tasks page lists your and your team's tasks with system number, operation, status, priority, assignees and due date, plus scopes, filters and a report.
 0:41
Transactions in Mstnd: follow every workflow from one screen
Learn the Mstnd Transactions page: see every workflow with its number, status, priority and progress, use scope and filters, export it and start a new workflow.