

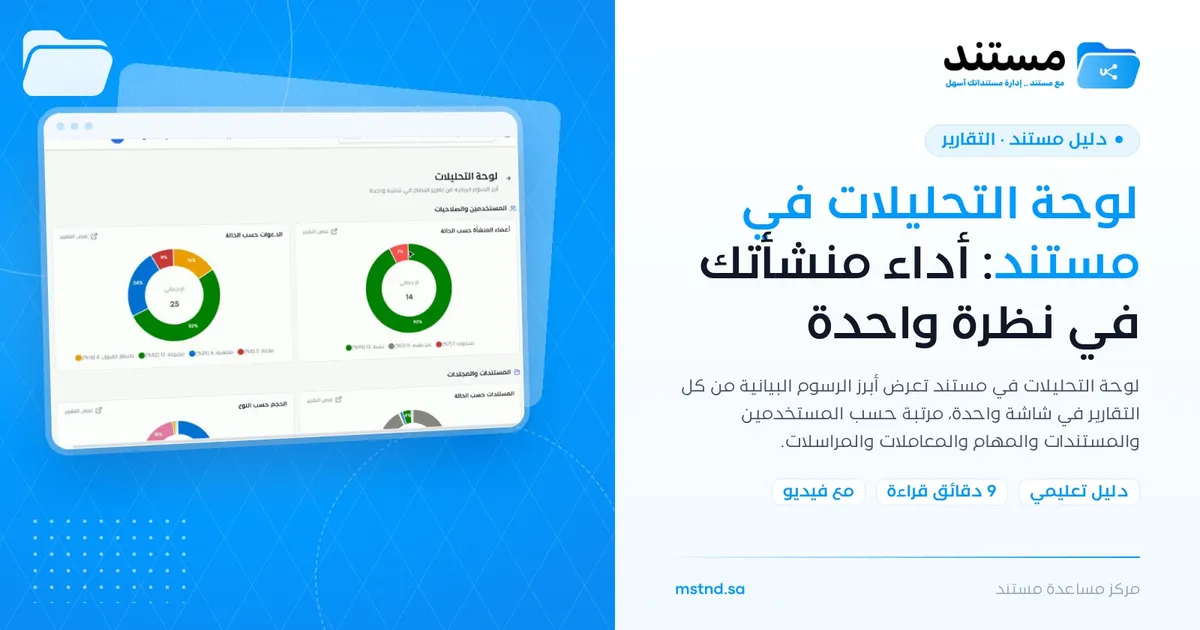
The analytics dashboard in Mstnd: your organization's performance at a glance
In this article
The analytics dashboard in Mstnd is a page that shows the key charts from all of the system's reports on one screen, grouped by section: users and permissions, documents and folders, tasks, transactions, administrative correspondence and more. You hover the mouse over any part of a chart to see its value, and you open the full report behind any chart with one click on «View report». It serves senior management and department managers who need a quick overall picture of the organization's performance before going into the details.
Quick overview
| Item | Details |
|---|---|
| Module | Reports |
| Where it is in the interface | Side menu «Reports» → the «Analytics dashboard» card at the top of the report center |
| Direct link | https://app.mstnd.sa/reports/overview |
| Goal | Give a complete view of the organization's indicators on one screen, with a direct path to the detailed report |
| Who it is for | Senior management, department managers, quality and planning officers, and anyone who prepares presentations for periodic meetings |
| Video length | About 25 seconds |
| What you will learn | Reading the charts by section, hovering to see values, and moving to the full report from «View report» |
Watch the video
The short video shows the analytics dashboard: its sections, how to read the charts and how to move to the full report of any chart.
Why this feature?
In management meetings one question keeps coming back: how are we doing? The answer is usually spread over several reports: one for users, another for tasks and a third for correspondence. Opening each report on its own takes time, makes it hard to see the full picture, and can lead a manager to focus on one section and overlook another.
The analytics dashboard solves this by gathering the one or two most important charts from each report on a single page. In a minute you see where performance is good and where something is wrong, and then you decide which report deserves a closer look.
| Before | After |
|---|---|
| Opening several reports to form an overall picture | All the main charts on one screen |
| Difficulty connecting the indicators of different sections | The sections follow one another on the same page |
| Numbers that need percentages calculated by hand | Charts that show percentages and values directly |
| Looking for the source report of every number | «View report» takes you straight to the full report |
The value for the organization is spotting problems early through a complete overview. The value for the manager is saving time when preparing for meetings and directing attention to what matters.
Where to find it
- From the side menu, open «Reports».
- At the top of the «Report center», click the «Analytics dashboard» card.
Direct link: https://app.mstnd.sa/reports/overview
To return to the report center, use the back arrow next to the page title.
Concepts and terms
| Term | Meaning in Mstnd |
|---|---|
| Analytics dashboard | A page that gathers the key charts from all of the system's reports |
| Section | A group of charts for one module, such as «Users and permissions» or «Administrative correspondence» |
| Pie chart | A chart that splits the total into categories by their share, with the total in the center |
| Bar chart | A chart that compares values with horizontal bars, such as the steps with the longest dwell time |
| Legend | The line under the chart that shows each category with its color, count and percentage |
| «View report» | A link in the corner of every chart that opens the full report the chart came from |
Step by step
Step 1: Open the analytics dashboard
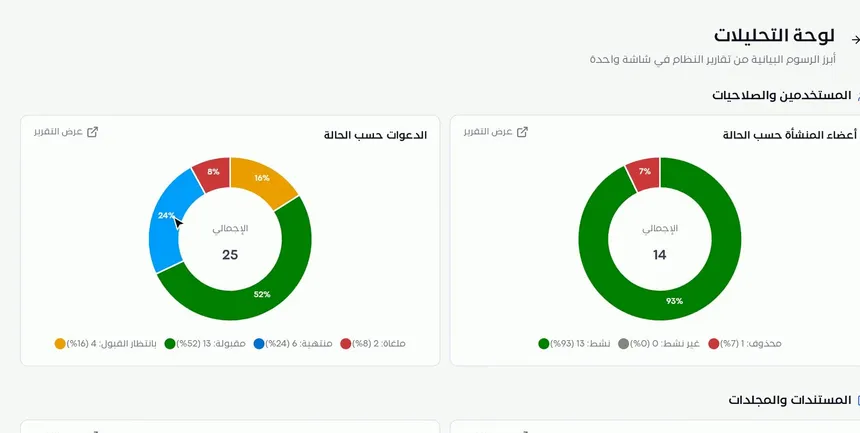
When you open the «Analytics dashboard», its title and description appear: the key charts from the system's reports on one screen. The view starts with the «Users and permissions» section, which includes, for example, the «Organization members by status» chart and the «Invitations by status» chart.
Each pie chart shows the total in its center, and under it a legend shows each category with its count and percentage, such as Active, Inactive and Deleted for members, or Accepted, Awaiting acceptance, Expired and Cancelled for invitations.
Step 2: Move between the sections and read the values
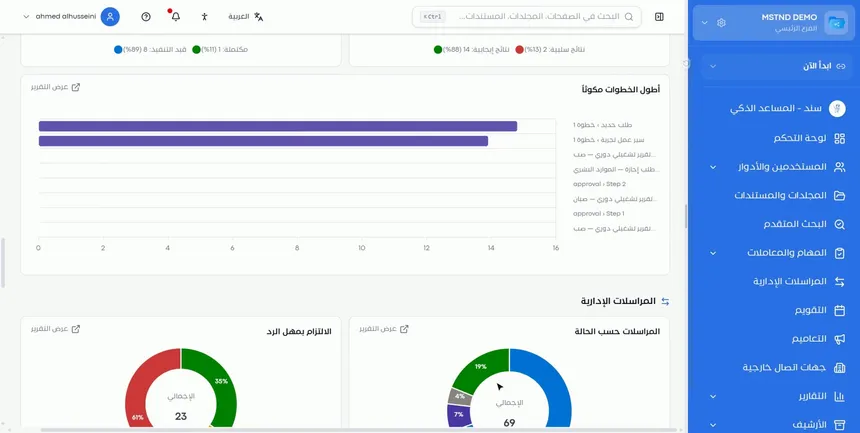
Scroll down the page to move between the sections: users, documents, tasks, transactions, correspondence and more. Examples of what appears on the page:
- Tasks: how tasks are split between completed and in progress, and their positive and negative outcomes.
- Transactions: the «Steps with the longest dwell time» chart, which shows the workflow steps where transactions stay the longest.
- Administrative correspondence: the «Correspondence by status» chart and the «Reply deadline compliance» chart.
Hover the mouse over any part of a chart to see its exact value.
The «Steps with the longest dwell time» chart is one of the most important charts for managers, because it reveals the bottleneck in your procedures. «Reply deadline compliance» shows the percentage of correspondence answered on time compared with the overdue items.
Step 3: Open the full report for any chart
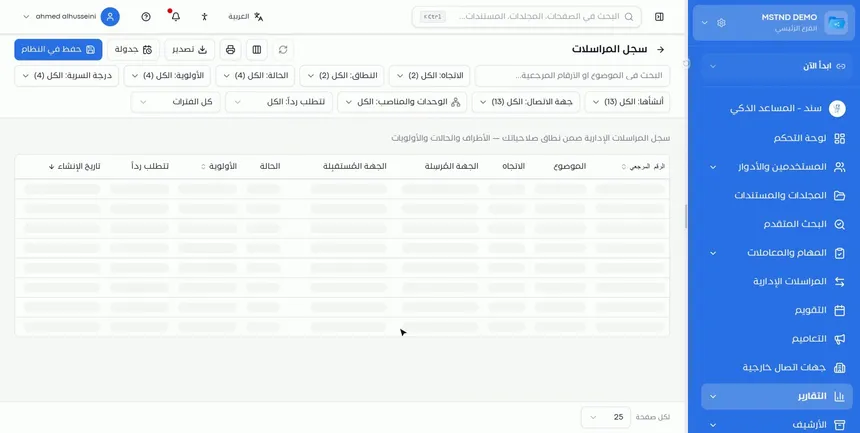
In the corner of every chart there is a «View report» link. Click it to go to the full report the chart came from. There you find the indicators, the filters, the data table and the export and scheduling options, as the Report page guide explains.
This is the right way to use the dashboard: you notice an unusual number in a chart, then you open its report to find out why. For example, if you see a large share of overdue correspondence in «Reply deadline compliance», you open the report and filter it by entity to find where the delay comes from.
Options and their effect
| Action | What it does | When to use it |
|---|---|---|
| Scrolling the page between sections | Shows the charts of each module in order | For a complete review of every aspect of the organization |
| Hovering the mouse over a chart | Shows the value of the part you point at | To find the exact value of a specific category |
| Reading the legend | Shows each category with its count and percentage | To read the chart without estimating |
| «View report» | Opens the chart's full report | When you need details, filtering or export |
| The back arrow | Takes you back to the report center | To choose another report |
How to read the main charts
| Chart | The question it answers | What calls for attention |
|---|---|---|
| Organization members by status | How many active users do we have? | A large share of inactive members |
| Invitations by status | Are invitees accepting their invitations? | Many invitations that are expired or awaiting acceptance |
| Tasks by status | How many tasks have been completed? | Tasks in progress piling up |
| Steps with the longest dwell time | Where do transactions get stuck? | One step taking up the longest time |
| Correspondence by status | How is correspondence spread across its statuses? | A lot of correspondence stuck in one status |
| Reply deadline compliance | Do we reply on time? | A high share of overdue items |
A suggested weekly review routine
To get regular value from the analytics dashboard, follow a fixed routine of no more than ten minutes at the start of each week:
- Correspondence first: review «Reply deadline compliance». If the share of overdue items has risen since last week, open the report and identify the entities that are late.
- Then transactions: review «Steps with the longest dwell time». If one step tops the list two weeks in a row, it needs attention in the workflow template or in how the responsible people are assigned.
- Then tasks: compare the share of completed tasks with the share in progress, and watch for open tasks piling up.
- Finally users: check the pending invitations and the inactive members.
- Write down your notes: record the three most notable numbers so you can compare them the following week.
With this routine, the dashboard turns from a page you open when needed into a regular follow-up tool that reveals trends before they become problems.
Practical scenarios
Scenario: Senior management in a government entity prepares for a monthly meeting
Situation: The director general needs a quick summary of the departments' performance before the meeting.
What you do in Mstnd:
- Open the «Analytics dashboard» and scroll through the sections.
- Focus on «Reply deadline compliance» and «Steps with the longest dwell time».
- Open «View report» for any chart that needs discussion, and export it to present in the meeting.
Result: A meeting built on actual numbers that focuses on the weak points rather than on impressions.
Scenario: The HR department of a trading company tracks account activation
Situation: Invitations were sent to new employees, and you need to know who has not activated their account.
What you do in Mstnd:
- Review the «Invitations by status» chart.
- Note the number of invitations awaiting acceptance or expired.
- Open the full report to find out who they belong to, then follow up with them from the Invitations page.
Result: Faster account activation, with no employees left outside the system.
Scenario: The operations manager of a hospital improves approval procedures
Situation: There are complaints that internal requests are slow to be approved.
What you do in Mstnd:
- Review the «Steps with the longest dwell time» chart in the transactions section.
- Identify the step that takes the longest.
- Review the workflow template concerned from Workflow template details.
Result: The step that holds things up is dealt with, instead of relying on guesswork.
Scenario: The administrative communications officer of a contracting company measures compliance
Situation: The officer wants to make sure that correspondence with external entities is answered on time.
What you do in Mstnd:
- Review «Reply deadline compliance» and «Correspondence by status».
- Open «View report» and filter by entity.
Result: You know which entities or departments are late in replying, and you can follow them up.
How it relates to other features
- Report center: the page you open the analytics dashboard from; it holds every report in detail.
- Report page: opens from «View report» and holds the filters, export and scheduling.
- Dashboard: focuses on what is waiting for you personally today, while the analytics dashboard focuses on the performance of the whole organization.
- Users: the data source of the organization members by status chart.
- Transactions: the data source of the steps with the longest dwell time chart.
- Administrative correspondence: the data source of the correspondence charts and the reply deadline compliance chart.
Tips and best practices
- Make the analytics dashboard the first page you review before any periodic meeting.
- Look for anomalies, not for big numbers: a high overdue percentage matters more than a large total.
- Use «View report» as soon as you notice an unexpected number, and do not stop at the chart.
- Compare the dashboard week by week to see the trend; a single number is not enough to judge.
- Focus on «Steps with the longest dwell time» when improving procedures, because it reveals where things get stuck.
- Remember that the charts reflect your permission scope, so they may differ from another manager's dashboard.
Warnings and common mistakes
FAQ
What is the analytics dashboard in Mstnd?
It is a page that shows the key charts from all of the system's reports on one screen, grouped by section.
How do I open the analytics dashboard?
From the side menu, open «Reports», then click the «Analytics dashboard» card at the top of the report center.
Which sections does the analytics dashboard show?
It shows sections that include users and permissions, documents and folders, tasks, transactions and administrative correspondence.
How do I find the exact value of part of a chart?
Hover the mouse over that part to see its value, or check the legend under the chart, which shows the count and percentage of each category.
How do I go from a chart to the full report?
Click «View report» in the corner of the chart, and the full report opens with its indicators, filters and data table.
What is the difference between the analytics dashboard and the Dashboard?
The Dashboard shows what is waiting for your own action today, while the analytics dashboard shows the organization's performance indicators from the reports.
Can the analytics dashboard be exported?
Export is done from the full report page, so open «View report» for the chart you need and export it from there.
Summary
- The analytics dashboard gathers the key report charts on one screen.
- The charts are grouped by section, from users to correspondence.
- The legend and hovering give you the exact values.
- «View report» is the path from an observation to detailed analysis.
- Use it to spot problems, then use the report page to find their cause.
Try it free: Create your organization's account in Mstnd
Was this article helpful?
Related articles
 0:43
The report center in Mstnd: all your organization's reports in one place
The Mstnd report center groups document, correspondence, task, transaction, circular and user reports by section, with quick search and an analytics dashboard.
 0:56
The report page in Mstnd: filter, export and schedule your report
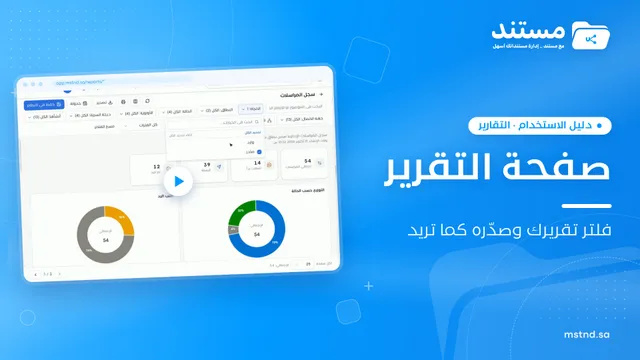
Learn the Mstnd report page: indicators and charts, filters, the data table, export to Excel, CSV and PDF, scheduling, and saving as a document in the system.
 1:57
The Mstnd Dashboard: everything waiting for you on one screen
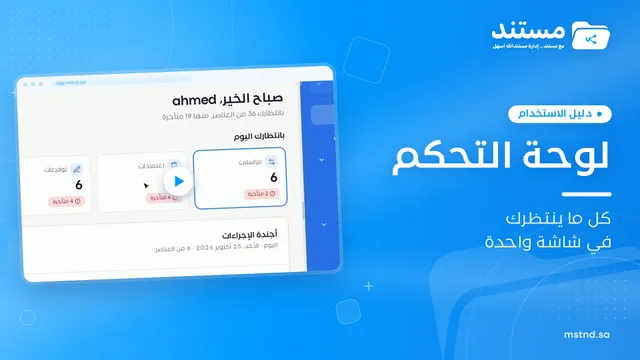
Learn the Mstnd Dashboard: the «Waiting for you today» cards, the Action agenda, workflows, Sanad recommendations, team activity and how to plan your day.
 1:03
Managing users in Mstnd: roles, status, positions and invitations
Learn the Mstnd Users page: search and filters, the user profile with effective permissions and positions, changing roles, deactivating, and inviting new staff.
 0:41
Transactions in Mstnd: follow every workflow from one screen
Learn the Mstnd Transactions page: see every workflow with its number, status, priority and progress, use scope and filters, export it and start a new workflow.
 0:50
Administrative correspondence in Mstnd: outgoing and incoming in one organized register
Administrative correspondence in Mstnd: outgoing and incoming in one register, indicators, filters by direction, status and confidentiality, and reply threads.